EMA/MA with OHCL Candle and Long Wick – A Comprehensive Trading
Dear Traders,
I am excited to introduce EMA/MA with OHCL Candle and Long Wick, a powerful trading indicator designed to enhance market analysis by combining Exponential Moving Averages (EMA), Simple Moving Averages (MA), OHCL candle patterns, and long wick detection into a single tool.
Key Features:
✅ Customizable Wick Size & Timeframe – Adapt the indicator to different market conditions by adjusting wick size and analyzing price action over any timeframe.
✅ EMA & MA for Trend Analysis – Includes multiple EMAs and MAs (5, 9, 15, 20, 50, 100, 200) to help identify trends and potential reversals.
✅ Long Wick Signal Detection – Identifies strong Buy and Sell opportunities based on wick size, signaling potential market turning points.
✅ OHCL Candle Analysis – Highlights OHCL patterns to provide additional insights into price action.
✅ User-Friendly & Lightweight – Efficiently coded for seamless performance on TradingView.
This indicator is perfect for traders looking to refine their entry and exit strategies by leveraging price action and moving averages. Whether you're a scalper, day trader, or swing trader, this tool provides valuable insights to enhance your decision-making.
Give it a try, and let me know your feedback! 🚀
Best regards,
Purnendu Singh
Search in scripts for "Exponential Moving Average"
TVMC - Composite Indicator with Technical RatingsDescription:
The TVMC (Trend, Volume, Momentum, Composite) indicator is a powerful multi-component tool designed to provide traders with a comprehensive understanding of market conditions. By combining four essential technical analysis components—trend, momentum, volume, and volatility—this indicator offers clear and actionable insights to assist in decision-making.
Key Features:
1. Trend Component (TC):
* Based on MACD (Moving Average Convergence Divergence), this component analyzes the relationship between two exponential moving averages (fast and slow) to determine the prevailing market trend.
* The MACD signal is normalized to a range of -1 to +1 for consistency and clarity.
2. Momentum Component (MC):
* Utilizes RSI (Relative Strength Index) to measure the strength and speed of price movements.
* This component highlights overbought or oversold conditions, which may indicate potential market reversals.
3. Volume Confirmation (VC):
* Compares the current trading volume to its moving average over a specified period.
* High volume relative to the average confirms the validity of the current trend.
4. Volatility Filter (VF):
* Uses ATR (Average True Range) to gauge market volatility.
* Adjusts and smooths signals to reduce noise during periods of high volatility.
5. Technical Ratings Integration:
* Incorporates TradingView’s Technical Ratings, allowing users to validate signals using moving averages, oscillators, or a combination of both.
* Users can choose their preferred source of ratings for enhanced signal confirmation.
How It Works:
The TVMC indicator combines the weighted contributions of the Trend, Momentum, and Volume components, further refined by the Volatility Filter. Each component plays a specific role:
* Trend: Identifies whether the market is bullish, bearish, or neutral.
* Momentum: Highlights the strength of price action.
* Volume: Confirms whether the current price action is supported by sufficient trading activity.
* Volatility: Filters out excessive noise in volatile market conditions, providing a smoother and more reliable output.
Visualization:
1. Bullish Signals:
* The indicator line turns green and remains above the zero line, indicating upward momentum.
2. Bearish Signals:
* The indicator line turns red and falls below the zero line, signaling downward momentum.
3. Neutral Signals:
* The line is orange and stays near zero, indicating a lack of strong trend or momentum.
4. Zones:
* Horizontal lines at +30 and -30 mark strong bullish and bearish zones, respectively.
* A zero line is included for clear separation between bullish and bearish signals.
Recommended Usage:
* Best Timeframes: The indicator is optimized for higher timeframes such as 4-hour (H4) and daily (D1) charts.
* Trading Style: Suitable for swing and positional trading.
* Customization: The indicator allows users to adjust all major parameters (e.g., MACD, RSI, volume, and ATR settings) to fit their trading preferences.
Customization Options:
* Adjustable weights for Trend, Momentum, and Volume components.
* Fully configurable settings for MACD, RSI, Volume SMA, and ATR periods.
* Timeframe selection for multi-timeframe analysis.
Important Notes:
1. Originality: The TVMC indicator combines multiple analysis methods into a unique framework. It does not replicate or minimally modify existing indicators.
2. Transparency: The description is detailed enough for users to understand the methodology without requiring access to the code.
3. Clarity: The indicator is explained in a way that is accessible even to users unfamiliar with complex technical analysis tools.
Compliance with TradingView Rules:
* The indicator is written in Pine Script version 5, adhering to TradingView’s language standards.
* The description is written in English to ensure accessibility to the global community, with a clear explanation of all components and functionality.
* No promotional content, links, or unrelated references are included.
* The chart accompanying the indicator is clean and demonstrates its intended use clearly, with no additional indicators unless explicitly explained.

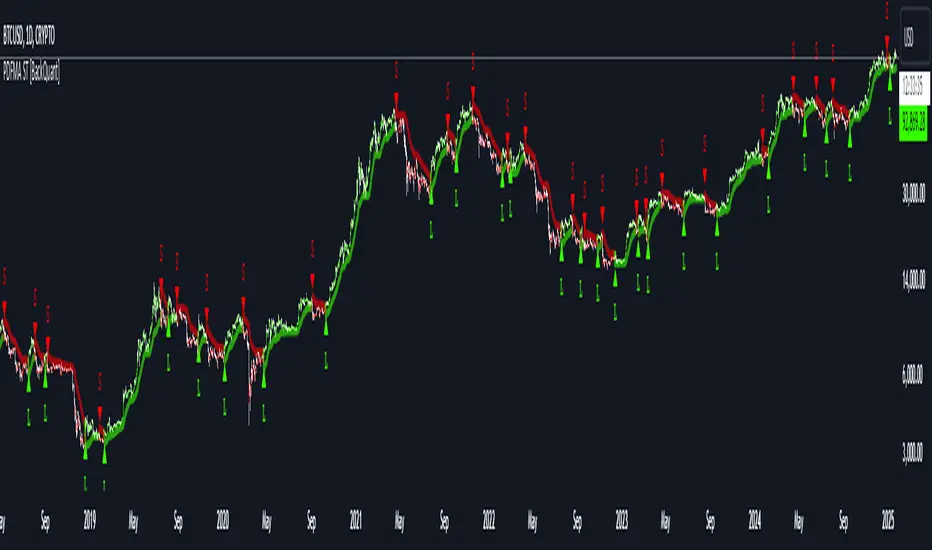
PDF-MA Supertrend [BackQuant]PDF-MA Supertrend
The PDF-MA Supertrend combines the innovative Probability Density Function (PDF) smoothing with the widely popular Supertrend methodology, creating a robust tool for identifying trends and generating actionable trading signals. This indicator is designed to provide precise entries and exits by dynamically adapting to market volatility while visualizing long and short opportunities directly on the chart.
Core Feature: PDF Smoothing
At the foundation of this indicator is the PDF smoothing technique, which applies a Probability Density Function to calculate a smoothed moving average. This method allows the indicator to assign adaptive weights to data points, making it responsive to market changes without overreacting to short-term volatility.
Key parameters include:
Variance: Controls the spread of the PDF weighting. A smaller variance results in sharper responses, while a larger variance smooths out the curve.
Mean: Shifts the PDF’s center, allowing traders to tweak how weights are distributed around the data points.
Smoothing Method: Offers the choice between EMA (Exponential Moving Average) and SMA (Simple Moving Average) for blending the PDF-smoothed data with traditional moving average methods.
By combining these parameters, the PDF smoothing creates a moving average that effectively captures underlying trends.
Supertrend: Adaptive Trend and Volatility Tracking
The Supertrend is a well-known volatility-based indicator that dynamically adjusts to market conditions using the ATR (Average True Range). In this script, the PDF-smoothed moving average acts as the price input, making the Supertrend calculation more adaptive and precise.
Key Supertrend Features:
ATR Period: Determines the lookback period for calculating market volatility.
Factor: Multiplies the ATR to set the distance between the Supertrend and the price. A higher factor creates wider bands, filtering out smaller price movements, while a lower factor captures tighter trends.
Dynamic Direction: The Supertrend flips its direction based on price interactions with the calculated upper and lower bands:
Uptrend : When the price is above the Supertrend, the direction turns bullish.
Downtrend : When the price is below the Supertrend, the direction turns bearish.
This combination of PDF smoothing and Supertrend calculation ensures that trends are detected with greater accuracy, while volatility filters out market noise.
Long and Short Signal Generation
The PDF-MA Supertrend generates actionable trading signals by detecting transitions in the trend direction:
Long Signal (𝕃): Triggered when the trend transitions from bearish to bullish. This is visually represented with a green triangle below the price bars.
Short Signal (𝕊): Triggered when the trend transitions from bullish to bearish. This is marked with a red triangle above the price bars.
These signals provide traders with clear entry and exit points, ensuring they can capitalize on emerging trends while avoiding false signals.
Customizable Visualization Options
The indicator offers a range of visualization settings to help traders interpret the data with ease:
Show Supertrend: Option to toggle the visibility of the Supertrend line.
Candle Coloring: Automatically colors candlesticks based on the trend direction:
Green for long trends.
Red for short trends.
Long and Short Signals (𝕃 + 𝕊): Displays long (𝕃) and short (𝕊) signals directly on the chart for quick identification of trade opportunities.
Line Color Customization: Allows users to customize the colors for long and short trends.
Alert Conditions
To ensure traders never miss an opportunity, the PDF-MA Supertrend includes built-in alerts for trend changes:
Long Signal Alert: Notifies when a bullish trend is identified.
Short Signal Alert: Notifies when a bearish trend is identified.
These alerts can be configured for real-time notifications via SMS, email, or push notifications, making it easier to stay updated on market movements.
Suggested Parameter Adjustments
The indicator’s effectiveness can be fine-tuned using the following guidelines:
Variance:
For low-volatility assets (e.g., indices): Use a smaller variance (1.0–1.5) for smoother trends.
For high-volatility assets (e.g., cryptocurrencies): Use a larger variance (1.5–2.0) to better capture rapid price changes.
ATR Factor:
A higher factor (e.g., 2.0) is better suited for long-term trend-following strategies.
A lower factor (e.g., 1.5) captures shorter-term trends.
Smoothing Period:
Shorter periods provide more reactive signals but may increase noise.
Longer periods offer stability and better alignment with significant trends.
Experimentation is encouraged to find the optimal settings for specific assets and trading strategies.
Trading Applications
The PDF-MA Supertrend is a versatile indicator suited to a variety of trading approaches:
Trend Following : Use the Supertrend line and signals to follow market trends and ride sustained price movements.
Reversal Trading : Spot potential trend reversals as the Supertrend flips direction.
Volatility Analysis : Adjust the ATR factor to filter out minor price fluctuations or capture sharp movements.
Final Thoughts
The PDF-MA Supertrend combines the precision of Probability Density Function smoothing with the adaptability of the Supertrend methodology, offering traders a powerful tool for identifying trends and volatility. With its customizable parameters, actionable signals, and built-in alerts, this indicator is an excellent choice for traders seeking a robust and reliable system for trend detection and entry/exit timing.
As always, backtesting and incorporating this indicator into a broader strategy are recommended for optimal results.
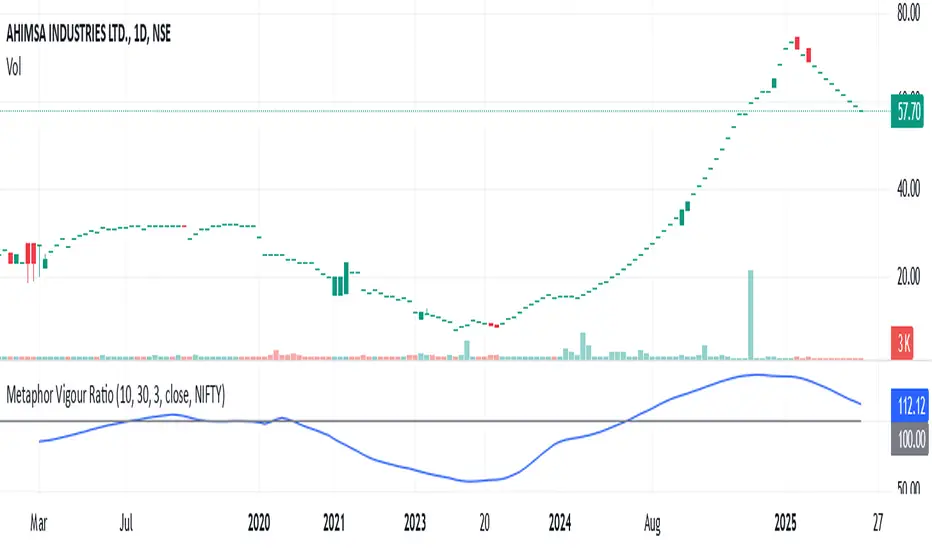
Metaphor Vigour Ratio### **Script Name:** Metaphor Vigour Ratio
**Short Title:** Metaphor Vigour Ratio
**Author:** Sovit Manjani, CMT
**Description:**
The Metaphor Vigour Ratio (MVRatio) is a powerful Relative Strength Indicator designed for assessing normalized relative strength. It is versatile and can be applied to any script or used to rank symbols based on their intermarket relative strength.
---
### **Features:**
1. **Bullish and Bearish Signals:**
- **Above 100:** Indicates a bullish trend.
- **Below 100:** Indicates a bearish trend.
2. **Trend Analysis with Slope:**
- **Slope Rising:** Suggests bullish momentum.
- **Slope Falling:** Suggests bearish momentum.
3. **Stock Selection Strategy:**
- Identify and rank stocks based on the MVRatio. For example, buy the top 10 stocks of Nifty with the highest MVRatio values for strong performance potential.
---
### **Inputs:**
1. **Fast EMA Period (RSEMAFast):** Default set to 10. Controls the sensitivity of the Fast Moving Average.
2. **Slow EMA Period (RSEMASlow):** Default set to 30. Provides a stable trend base with the Slow Moving Average.
3. **Smooth EMA Period (SmoothEMA):** Default set to 3. Smooths the MVRatio for better clarity.
4. **Close Source:** Default is the closing price, but it can be customized as needed.
5. **Comparative Symbol (ComparativeTickerId):** Default is "NSE:NIFTY," allowing comparison against a benchmark index.
---
### **Calculation Logic:**
1. **Relative Strength (RS):**
- Calculated as the ratio of the base symbol's price to the comparative symbol's price.
2. **Exponential Moving Averages (FastMA and SlowMA):**
- Applied to the RS to smooth and differentiate trends.
3. **Metaphor Vigour Ratio (MVRatio):**
- Computed as the ratio of FastMA to SlowMA, scaled by 100, and further smoothed using SmoothEMA.
---
### **Visualization:**
1. **MVRatio Plot (Blue):**
- Represents the relative strength dynamics.
2. **Reference Line at 100 (Gray):**
- Helps quickly identify bullish (above 100) and bearish (below 100) zones.
---
### **How to Use:**
1. Add the indicator to your chart from TradingView's Pine Script editor.
2. Compare the performance of any symbol relative to a benchmark (e.g., Nifty).
3. Analyze trends, slopes, and ranking based on MVRatio values to make informed trading decisions.
---
**Note:** This indicator is for educational purposes and should be used alongside other analysis methods to make trading decisions.
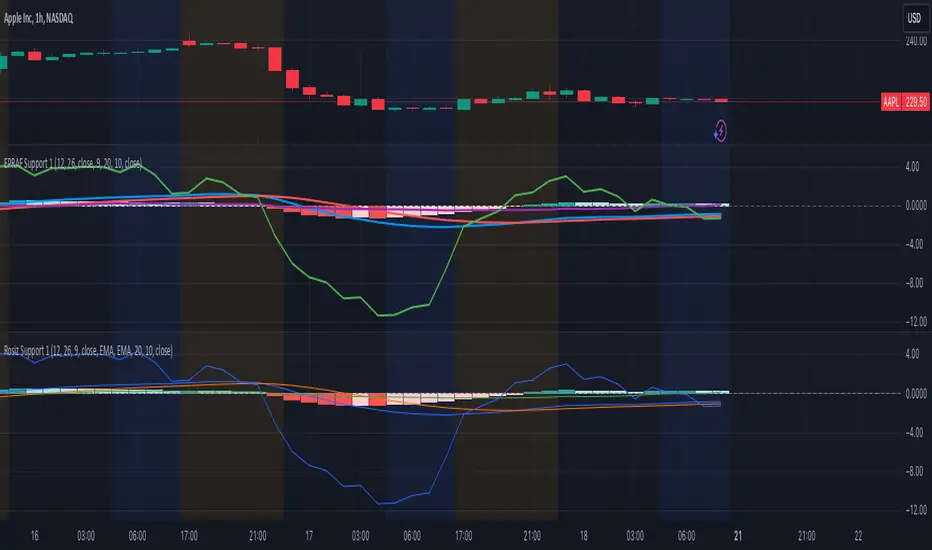
Rosiz Support 1### Description of the Custom Indicator: MACD + CMF + MOM
This custom indicator combines three powerful technical analysis tools: **MACD (Moving Average Convergence Divergence)**, **CMF (Chaikin Money Flow)**, and **MOM (Momentum)**, to provide a comprehensive view of market trends, momentum, and money flow in a single pane. Here's what each component offers:
---
#### 1. **MACD (Moving Average Convergence Divergence)**
The **MACD** is a trend-following momentum indicator that shows the relationship between two moving averages of an asset’s price.
- **Purpose**: Identifies trend direction and momentum strength.
- **Key Components**:
- **MACD Line**: Difference between the fast and slow exponential moving averages (EMA).
- **Signal Line**: A smoothed moving average of the MACD line, acting as a trigger for buy/sell signals.
- **Histogram**: The difference between the MACD line and the signal line. Positive values indicate bullish momentum, while negative values indicate bearish momentum.
- **Usage**: Look for crossovers (MACD crossing the signal line) to identify potential trend changes.
---
#### 2. **CMF (Chaikin Money Flow)**
The **CMF** measures the volume-weighted average of accumulation and distribution over a specific period. It shows whether money is flowing into or out of an asset.
- **Purpose**: Detects buying or selling pressure based on price and volume.
- **Key Components**:
- **Positive CMF**: Indicates that the asset is being accumulated (buying pressure).
- **Negative CMF**: Indicates that the asset is being distributed (selling pressure).
- **Usage**: Values above 0 suggest bullish strength, while values below 0 suggest bearish strength.
---
#### 3. **MOM (Momentum)**
The **Momentum Indicator** measures the rate of change of an asset's price over a specified period. It helps traders identify the speed of price movements.
- **Purpose**: Highlights the strength and direction of price momentum.
- **Key Components**:
- **Momentum Line**: Positive values indicate upward momentum, while negative values indicate downward momentum.
- **Usage**: A rising momentum line suggests strengthening price trends, while a falling line indicates weakening trends.
---
### Benefits of Combining These Indicators:
1. **Trend Confirmation**: MACD provides a clear picture of trend direction and potential reversals.
2. **Volume-Based Insights**: CMF adds a layer of confirmation by analyzing money flow based on price and volume.
3. **Momentum Analysis**: MOM reveals the speed and strength of price movements, helping traders confirm breakouts or trend exhaustion.
4. **Enhanced Decision-Making**: The combination of these indicators allows traders to make more informed decisions by evaluating different aspects of market behavior in one pane.
---
### How to Use:
- **Identify Trends**: Use MACD to identify overall trend direction and reversals.
- **Confirm Momentum**: Check MOM to validate the strength of the trend.
- **Gauge Buying/Selling Pressure**: Refer to CMF to confirm whether the price movement is backed by accumulation or distribution.
- **Entry/Exit Points**: Look for MACD crossovers, CMF shifts above/below zero, and momentum changes to refine entry and exit strategies.
This powerful tool integrates the strengths of three indicators, making it ideal for traders looking to analyze market conditions holistically and improve their timing and accuracy.
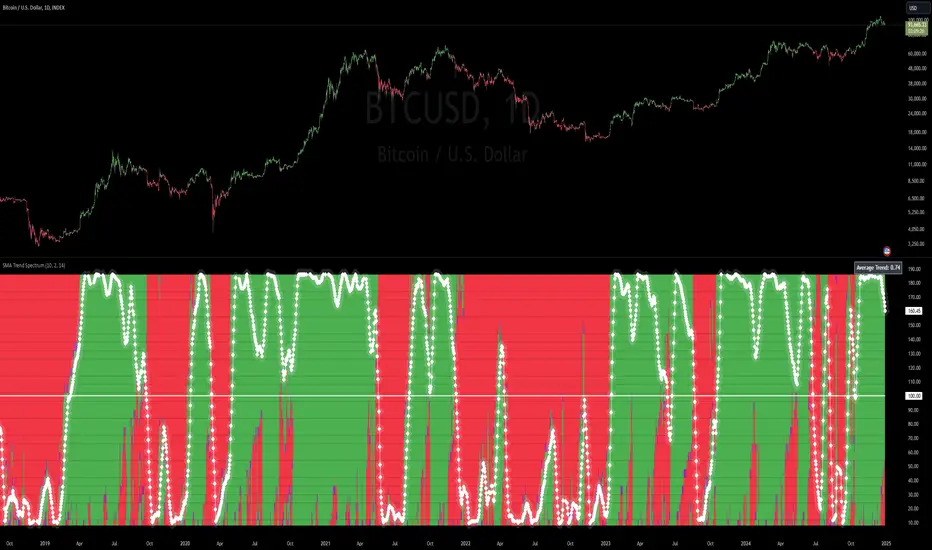
SMA Trend Spectrum [InvestorUnknown]The SMA Trend Spectrum indicator is designed to visually represent market trends and momentum by using a series of Simple Moving Averages (SMAs) to create a color-coded spectrum or heatmap. This tool helps traders identify the strength and direction of market trends across various time frames within one chart.
Functionality:
SMA Calculation: The indicator calculates multiple SMAs starting from a user-defined base period (Starting Period) and increasing by a specified increment (Period Increment). This creates a sequence of moving averages that span from short-term to long-term perspectives.
Trend Analysis: Each segment of the spectrum compares three SMAs to determine the market's trend strength: Bullish (color-coded green) when the current price is above all three SMAs. Neutral (color-coded purple) when the price is above some but not all SMAs. Bearish (color-coded red) when the price is below all three SMAs.
f_col(x1, x2, x3) =>
min = ta.sma(src, x1)
mid = ta.sma(src, x2)
max = ta.sma(src, x3)
c = src > min and src > mid and src > max ? bull : src > min or src > mid or src > max ? ncol : bear
Heatmap Visualization: The indicator plots these trends as a vertical spectrum where each row represents a different set of SMAs, forming a heatmap-like display. The color of each segment in the heatmap directly correlates with market conditions, providing an intuitive view of market sentiment.
Signal Smoothing: Users can choose to smooth the trend signal using either a Simple Moving Average (SMA), Exponential Moving Average (EMA), or leave it as raw data (Signal Smoothing). The length of smoothing can be adjusted (Smoothing Length). The signal is displayed in a scaled way to automatically adjust for the best visual experience, ensuring that the trend is clear and easily interpretable across different chart scales and time frames
Additional Features:
Plot Signal: Optionally plots a line representing the average trend across all calculated SMAs. This line helps in identifying the overall market direction based on the spectrum data.
Bar Coloring: Bars on the chart can be colored according to the average trend strength, providing a quick visual cue of market conditions.
Usage:
Trend Identification: Use the heatmap to quickly assess if the market is trending strongly in one direction or if it's in a consolidation phase.
Entry/Exit Points: Look for shifts in color patterns to anticipate potential trend changes or confirmations for entry or exit points.
Momentum Analysis: The gradient from bearish to bullish across the spectrum can be used to gauge momentum and potentially forecast future price movements.
Notes:
The effectiveness of this indicator can vary based on market conditions, asset volatility, and the chosen SMA periods and increments.
It's advisable to combine this tool with other technical indicators or fundamental analysis for more robust trading decisions.
Disclaimer: Past performance does not guarantee future results. Always use this indicator as part of a broader trading strategy.
three Supertrend EMA Strategy by Prasanna +DhanuThe indicator described in your Pine Script is a Supertrend EMA Strategy that combines the Supertrend and EMA (Exponential Moving Average) to create a trend-following strategy. Here’s a detailed breakdown of how this indicator works:
1. EMA (Exponential Moving Average):
The EMA is a moving average that places more weight on recent prices, making it more responsive to price changes compared to a simple moving average (SMA). In this strategy, the EMA is used to determine the overall trend direction.
Input Parameter:
ema_length: This is the period for the EMA, set to 50 periods by default. A shorter EMA will respond more quickly to price movements, while a longer EMA is smoother and less sensitive to short-term fluctuations.
How it's used:
If the price is above the EMA, it indicates an uptrend.
If the price is below the EMA, it indicates a downtrend.
2. Supertrend Indicator:
The Supertrend indicator is a trend-following tool based on the Average True Range (ATR), which is a volatility measure. It helps to identify the direction of the trend by setting a dynamic support or resistance level.
Input Parameters:
supertrend_atr_period: The period used for calculating the ATR, set to 10 periods by default.
supertrend_multiplier1: Multiplier for the first Supertrend, set to 3.0.
supertrend_multiplier2: Multiplier for the second Supertrend, set to 2.0.
supertrend_multiplier3: Multiplier for the third Supertrend, set to 1.0.
Each Supertrend line has a different multiplier, which affects its sensitivity to price changes. The ATR period defines how many periods of price data are used to calculate the ATR.
How the Supertrend works:
If the Supertrend value is below the price, the trend is considered bullish (uptrend).
If the Supertrend value is above the price, the trend is considered bearish (downtrend).
The Supertrend will switch between up and down based on price movement and ATR, providing a dynamic trend-following signal.
3. Three Supertrend Lines:
In this strategy, three Supertrend lines are calculated with different multipliers and the same ATR period (10 periods). Each line is more or less sensitive to price changes, and they are plotted on the chart in different colors based on whether the trend is bullish (green) or bearish (red).
Supertrend 1: The most sensitive Supertrend with a multiplier of 3.0.
Supertrend 2: A moderately sensitive Supertrend with a multiplier of 2.0.
Supertrend 3: The least sensitive Supertrend with a multiplier of 1.0.
Each Supertrend line signals a bullish trend when its value is below the price and a bearish trend when its value is above the price.
4. Strategy Rules:
This strategy uses the three Supertrend lines combined with the EMA to generate trade signals.
Entry Conditions:
A long entry is triggered when all three Supertrend lines are in an uptrend (i.e., all three Supertrend lines are below the price), and the price is above the EMA. This suggests a strong bullish market condition.
A short entry is triggered when all three Supertrend lines are in a downtrend (i.e., all three Supertrend lines are above the price), and the price is below the EMA. This suggests a strong bearish market condition.
Exit Conditions:
A long exit occurs when the third Supertrend (the least sensitive one) switches to a downtrend (i.e., the price falls below it).
A short exit occurs when the third Supertrend switches to an uptrend (i.e., the price rises above it).
5. Visualization:
The strategy also plots the following on the chart:
The EMA is plotted as a blue line, which helps identify the overall trend.
The three Supertrend lines are plotted with different colors:
Supertrend 1: Green (for uptrend) and Red (for downtrend).
Supertrend 2: Green (for uptrend) and Red (for downtrend).
Supertrend 3: Green (for uptrend) and Red (for downtrend).
Summary of the Strategy:
The strategy combines three Supertrend indicators (with different multipliers) and an EMA to capture both short-term and long-term trends.
Long positions are entered when all three Supertrend lines are bullish and the price is above the EMA.
Short positions are entered when all three Supertrend lines are bearish and the price is below the EMA.
Exits occur when the third Supertrend line (the least sensitive) signals a change in trend direction.
This combination of indicators allows for a robust trend-following strategy that adapts to both short-term volatility and long-term trend direction. The Supertrend lines provide quick reaction to price changes, while the EMA offers a smoother, more stable trend direction for confirmation.
The indicator described in your Pine Script is a Supertrend EMA Strategy that combines the Supertrend and EMA (Exponential Moving Average) to create a trend-following strategy. Here’s a detailed breakdown of how this indicator works:
1. EMA (Exponential Moving Average):
The EMA is a moving average that places more weight on recent prices, making it more responsive to price changes compared to a simple moving average (SMA). In this strategy, the EMA is used to determine the overall trend direction.
Input Parameter:
ema_length: This is the period for the EMA, set to 50 periods by default. A shorter EMA will respond more quickly to price movements, while a longer EMA is smoother and less sensitive to short-term fluctuations.
How it's used:
If the price is above the EMA, it indicates an uptrend.
If the price is below the EMA, it indicates a downtrend.
2. Supertrend Indicator:
The Supertrend indicator is a trend-following tool based on the Average True Range (ATR), which is a volatility measure. It helps to identify the direction of the trend by setting a dynamic support or resistance level.
Input Parameters:
supertrend_atr_period: The period used for calculating the ATR, set to 10 periods by default.
supertrend_multiplier1: Multiplier for the first Supertrend, set to 3.0.
supertrend_multiplier2: Multiplier for the second Supertrend, set to 2.0.
supertrend_multiplier3: Multiplier for the third Supertrend, set to 1.0.
Each Supertrend line has a different multiplier, which affects its sensitivity to price changes. The ATR period defines how many periods of price data are used to calculate the ATR.
How the Supertrend works:
If the Supertrend value is below the price, the trend is considered bullish (uptrend).
If the Supertrend value is above the price, the trend is considered bearish (downtrend).
The Supertrend will switch between up and down based on price movement and ATR, providing a dynamic trend-following signal.
3. Three Supertrend Lines:
In this strategy, three Supertrend lines are calculated with different multipliers and the same ATR period (10 periods). Each line is more or less sensitive to price changes, and they are plotted on the chart in different colors based on whether the trend is bullish (green) or bearish (red).
Supertrend 1: The most sensitive Supertrend with a multiplier of 3.0.
Supertrend 2: A moderately sensitive Supertrend with a multiplier of 2.0.
Supertrend 3: The least sensitive Supertrend with a multiplier of 1.0.
Each Supertrend line signals a bullish trend when its value is below the price and a bearish trend when its value is above the price.
4. Strategy Rules:
This strategy uses the three Supertrend lines combined with the EMA to generate trade signals.
Entry Conditions:
A long entry is triggered when all three Supertrend lines are in an uptrend (i.e., all three Supertrend lines are below the price), and the price is above the EMA. This suggests a strong bullish market condition.
A short entry is triggered when all three Supertrend lines are in a downtrend (i.e., all three Supertrend lines are above the price), and the price is below the EMA. This suggests a strong bearish market condition.
Exit Conditions:
A long exit occurs when the third Supertrend (the least sensitive one) switches to a downtrend (i.e., the price falls below it).
A short exit occurs when the third Supertrend switches to an uptrend (i.e., the price rises above it).
5. Visualization:
The strategy also plots the following on the chart:
The EMA is plotted as a blue line, which helps identify the overall trend.
The three Supertrend lines are plotted with different colors:
Supertrend 1: Green (for uptrend) and Red (for downtrend).
Supertrend 2: Green (for uptrend) and Red (for downtrend).
Supertrend 3: Green (for uptrend) and Red (for downtrend).
Summary of the Strategy:
The strategy combines three Supertrend indicators (with different multipliers) and an EMA to capture both short-term and long-term trends.
Long positions are entered when all three Supertrend lines are bullish and the price is above the EMA.
Short positions are entered when all three Supertrend lines are bearish and the price is below the EMA.
Exits occur when the third Supertrend line (the least sensitive) signals a change in trend direction.
This combination of indicators allows for a robust trend-following strategy that adapts to both short-term volatility and long-term trend direction. The Supertrend lines provide quick reaction to price changes, while the EMA offers a smoother, more stable trend direction for confirmation.

3 EMA + RSI with Trail Stop [Free990] (LOW TF)This trading strategy combines three Exponential Moving Averages (EMAs) to identify trend direction, uses RSI to signal exit conditions, and applies both a fixed percentage stop-loss and a trailing stop for risk management. It aims to capture momentum when the faster EMAs cross the slower EMA, then uses RSI thresholds, time-based exits, and stops to close trades.
Short Explanation of the Logic
Trend Detection: When the 10 EMA crosses above the 20 EMA and both are above the 100 EMA (and the current price bar closes higher), it triggers a long entry signal. The reverse happens for a short (the 10 EMA crosses below the 20 EMA and both are below the 100 EMA).
RSI Exit: RSI crossing above a set threshold closes long trades; crossing below another threshold closes short trades.
Time-Based Exit: If a trade is in profit after a set number of bars, the strategy closes it.
Stop-Loss & Trailing Stop: A fixed stop-loss based on a percentage from the entry price guards against large drawdowns. A trailing stop dynamically tightens as the trade moves in favor, locking in potential gains.
Detailed Explanation of the Strategy Logic
Exponential Moving Average (EMA) Setup
Short EMA (out_a, length=10)
Medium EMA (out_b, length=20)
Long EMA (out_c, length=100)
The code calculates three separate EMAs to gauge short-term, medium-term, and longer-term trend behavior. By comparing their relative positions, the strategy infers whether the market is bullish (EMAs stacked positively) or bearish (EMAs stacked negatively).
Entry Conditions
Long Entry (entryLong): Occurs when:
The short EMA (10) crosses above the medium EMA (20).
Both EMAs (short and medium) are above the long EMA (100).
The current bar closes higher than it opened (close > open).
This suggests that momentum is shifting to the upside (short-term EMAs crossing up and price action turning bullish). If there’s an existing short position, it’s closed first before opening a new long.
Short Entry (entryShort): Occurs when:
The short EMA (10) crosses below the medium EMA (20).
Both EMAs (short and medium) are below the long EMA (100).
The current bar closes lower than it opened (close < open).
This indicates a potential shift to the downside. If there’s an existing long position, that gets closed first before opening a new short.
Exit Signals
RSI-Based Exits:
For long trades: When RSI exceeds a specified threshold (e.g., 70 by default), it triggers a long exit. RSI > short_rsi generally means overbought conditions, so the strategy exits to lock in profits or avoid a pullback.
For short trades: When RSI dips below a specified threshold (e.g., 30 by default), it triggers a short exit. RSI < long_rsi indicates oversold conditions, so the strategy closes the short to avoid a bounce.
Time-Based Exit:
If the trade has been open for xBars bars (configurable, e.g., 24 bars) and the trade is in profit (current price above entry for a long, or current price below entry for a short), the strategy closes the position. This helps lock in gains if the move takes too long or momentum stalls.
Stop-Loss Management
Fixed Stop-Loss (% Based): Each trade has a fixed stop-loss calculated as a percentage from the average entry price.
For long positions, the stop-loss is set below the entry price by a user-defined percentage (fixStopLossPerc).
For short positions, the stop-loss is set above the entry price by the same percentage.
This mechanism prevents catastrophic losses if the market moves strongly against the position.
Trailing Stop:
The strategy also sets a trail stop using trail_points (the distance in price points) and trail_offset (how quickly the stop “catches up” to price).
As the market moves in favor of the trade, the trailing stop gradually tightens, allowing profits to run while still capping potential drawdowns if the price reverses.
Order Execution Flow
When the conditions for a new position (long or short) are triggered, the strategy first checks if there’s an opposite position open. If there is, it closes that position before opening the new one (prevents going “both long and short” simultaneously).
RSI-based and time-based exits are checked on each bar. If triggered, the position is closed.
If the position remains open, the fixed stop-loss and trailing stop remain in effect until the position is exited.
Why This Combination Works
Multiple EMA Cross: Combining 10, 20, and 100 EMAs balances short-term momentum detection with a longer-term trend filter. This reduces false signals that can occur if you only look at a single crossover without considering the broader trend.
RSI Exits: RSI provides a momentum oscillator view—helpful for detecting overbought/oversold conditions, acting as an extra confirmation to exit.
Time-Based Exit: Prevents “lingering trades.” If the position is in profit but failing to advance further, it takes profit rather than risking a trend reversal.
Fixed & Trailing Stop-Loss: The fixed stop-loss is your safety net to cap worst-case losses. The trailing stop allows the strategy to lock in gains by following the trade as it moves favorably, thus maximizing profit potential while keeping risk in check.
Overall, this approach tries to capture momentum from EMA crossovers, protect profits with trailing stops, and limit risk through both a fixed percentage stop-loss and exit signals from RSI/time-based logic.

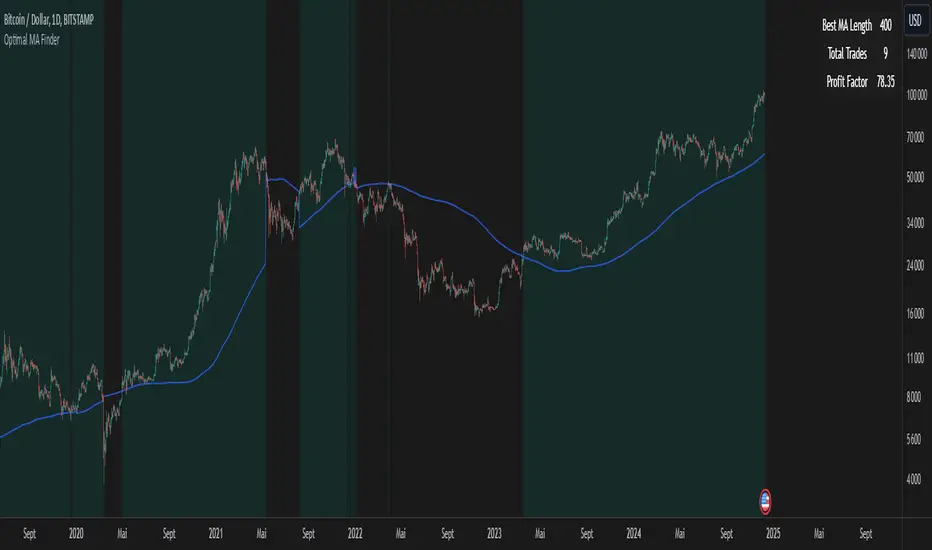
Optimal MA FinderIntroduction to the "Optimal MA Finder" Indicator
The "Optimal MA Finder" is a powerful and versatile tool designed to help traders optimize their moving average strategies. This script combines flexibility, precision, and automation to identify the most effective moving average (MA) length for your trading approach. Whether you're aiming to improve your long-only strategy or implement a buy-and-sell methodology, the "Optimal MA Finder" is your go-to solution for enhanced decision-making.
What Does It Do?
The script evaluates a wide range of moving average lengths, from 10 to 500, to determine which one produces the best results based on historical data. By calculating critical metrics such as the total number of trades and the profit factor for each MA length, it identifies the one that maximizes profitability. It supports both simple moving averages (SMA) and exponential moving averages (EMA), allowing you to tailor the analysis to your preferred method.
The logic works by backtesting each MA length against the price data and assessing the performance under two strategies:
Buy & Sell: Includes both long and short trades.
Long Only: Focuses solely on long positions for more conservative strategies.
Once the optimal MA length is identified, the script overlays it on the chart, highlighting periods when the price crosses over or under the optimal MA, helping traders identify potential entry and exit points.
Why Is It Useful?
This indicator stands out for its ability to automate a task that is often labor-intensive and subjective: finding the best MA length. By providing a clear, data-driven answer, it saves traders countless hours of manual testing while significantly enhancing the accuracy of their strategies. For example, instead of guessing whether a 50-period EMA is more effective than a 200-period SMA, the "Optimal MA Finder" will pinpoint the exact length and type of MA that has historically yielded the best results for your chosen strategy.
Key Benefits:
Precision: Identifies the MA length with the highest profit factor for maximum profitability.
Automation: Conducts thorough backtesting without manual effort.
Flexibility: Adapts to your preferred MA type (SMA or EMA) and trading strategy (Buy & Sell or Long Only).
Real-Time Feedback: Provides actionable insights by plotting the optimal MA directly on your chart and highlighting relevant trading periods.
Example of Use: Imagine you're trading a volatile stock and want to optimize your long-only strategy. By applying the "Optimal MA Finder," you discover that a 120-period EMA results in the highest profit factor. The indicator plots this EMA on your chart, showing you when to consider entering or exiting positions based on price movements relative to the EMA.
In short, the "Optimal MA Finder" empowers traders by delivering data-driven insights and improving the effectiveness of trading strategies. Its clear logic, combined with robust automation, makes it an invaluable tool for both novice and experienced traders seeking consistent results.
Azlan MA Silang PLUS++Overview
Azlan MA Silang PLUS++ is an advanced moving average crossover trading indicator designed for traders who want to jump back into the market when they missed their first opportunity to take a trade. It implements a sophisticated dual moving average system with customizable settings and re-entry signals, making it suitable for both trend following and swing trading strategies.
Key Features
• Dual Moving Average System with multiple MA types (EMA, SMA, WMA, LWMA)
• Customizable price sources for each moving average
• Smart re-entry system with configurable maximum re-entries
• Visual signals with background coloring and shape markers
• Comprehensive alert system for both initial and re-entry signals
• Flexible parameter customization through input options
Input Parameters
Moving Average Configuration
• MA1 Type: Choice between SMA, EMA, WMA, LWMA (default: EMA)
• MA2 Type: Choice between SMA, EMA, WMA, LWMA (default: EMA)
• MA1 Length: Minimum value 1 (default: 8)
• MA2 Length: Minimum value 1 (default: 15)
• MA1 & MA2 Shift: Offset values for moving averages
• Price Sources: Configurable for each MA (Open, High, Low, Close, HL/2, HLC/3, HLCC/4)
Re-entry System
• Enable/Disable re-entry signals
• Maximum re-entries allowed (default: 3)
Technical Implementation
Price Source Calculation
The script implements a flexible price source system through the price_source() function:
• Supports standard OHLC values
• Includes compound calculations (HL/2, HLC/3, HLCC/4)
• Defaults to close price if invalid source specified
Moving Average Types
Implements four MA calculations:
1. SMA (Simple Moving Average)
2. EMA (Exponential Moving Average)
3. WMA (Weighted Moving Average)
4. LWMA (Linear Weighted Moving Average)
Signal Generation Logic
Initial Signals
• Buy Signal: MA1 crosses above MA2 with price above both MAs
• Sell Signal: MA1 crosses below MA2 with price below both MAs
Re-entry Signals
Re-entry system activates when:
1. Price crosses under MA1 in buy mode (or over in sell mode)
2. Price returns to cross back over MA1 (or under for sells)
3. Position relative to MA2 confirms trend direction
4. Number of re-entries hasn't exceeded maximum allowed
Visual Components
• MA1: Blue line (width: 2)
• MA2: Red line (width: 2)
• Background Colors:
o Green (60% opacity): Bullish conditions
o Red (60% opacity): Bearish conditions
• Signal Markers:
o Initial Buy/Sell: Up/Down arrows with "BUY"/"SELL" labels
o Re-entry Buy/Sell: Up/Down arrows with "RE-BUY"/"RE-SELL" labels
Alert System
Generates alerts for:
• Initial buy/sell signals
• Re-entry opportunities
• Alerts include ticker and timeframe information
• Configured for once-per-bar-close frequency
Usage Tips
1. Moving Average Selection
o Shorter periods (MA1) capture faster moves
o Longer periods (MA2) identify overall trend
o EMA responds faster to price changes than SMA
2. Re-entry System
o Best used in strong trending markets
o Limit maximum re-entries based on market volatility
o Monitor price action around MA1 for potential re-entry points
3. Risk Management
o Use additional confirmation indicators
o Set appropriate stop-loss levels
o Consider market conditions when using re-entry signals
Code Structure
The script follows a modular design with distinct sections:
1. Input parameter definitions
2. Helper functions for price and MA calculations
3. Main signal generation logic
4. Visual elements and plotting
5. Alert system implementation
This organization makes the code maintainable and easy to modify for custom needs.

USDT.D Volatility TrackerUSDT.D Volatility Tracker
Description:
This script is designed to track the volatility of USDT.D (US Dollar in cryptocurrency) on the TradingView platform. It uses a moving average and deviation from it to generate buy and sell signals, helping traders visualize changes in volatility and make informed decisions.
Input Parameters:
maPeriod: The period of the moving average (default 120). This parameter allows users to adjust the length of the period used to calculate the moving average.
devThreshold: The deviation threshold (default 0.6). This parameter defines the level of deviation that will trigger buy or sell signals.
Data Request:
The script requests closing data for USDT.D using the request.security function, allowing it to retrieve up-to-date data on the selected timeframe.
Moving Average and Deviation Calculation:
An exponential moving average (EMA) is used to calculate the deviation from the moving average, enabling the identification of current volatility.
Deviation Line Display:
The deviation rate line is displayed on the chart, allowing users to visually track changes in volatility.
Signal Generation:
If the deviation exceeds the set threshold (devThreshold), a buy signal is generated (green background).
If the deviation falls below the negative threshold (-devThreshold), a sell signal is generated (red background).
Visual Signals:
Buy signals are displayed on the chart as green triangles, while sell signals are displayed as red triangles. This helps traders quickly identify potential entry and exit points.

Adaptive Squeeze Momentum StrategyThe Adaptive Squeeze Momentum Strategy is a versatile trading algorithm designed to capitalize on periods of low volatility that often precede significant price movements. By integrating multiple technical indicators and customizable settings, this strategy aims to identify optimal entry and exit points for both long and short positions.
Key Features:
Long/Short Trade Control:
Toggle Options: Easily enable or disable long and short trades according to your trading preferences or market conditions.
Flexible Application: Adapt the strategy for bullish, bearish, or neutral market outlooks.
Squeeze Detection Mechanism:
Bollinger Bands and Keltner Channels: Utilizes the convergence of Bollinger Bands inside Keltner Channels to detect "squeeze" conditions, indicating a potential breakout.
Dynamic Squeeze Length: Calculates the average squeeze duration to adapt to changing market volatility.
Momentum Analysis:
Linear Regression: Applies linear regression to price changes over a specified momentum length to gauge the strength and direction of momentum.
Dynamic Thresholds: Sets momentum thresholds based on standard deviations, allowing for adaptive sensitivity to market movements.
Momentum Multiplier: Adjustable setting to fine-tune the aggressiveness of momentum detection.
Trend Filtering:
Exponential Moving Average (EMA): Implements a trend filter using an EMA to align trades with the prevailing market direction.
Customizable Length: Adjust the EMA length to suit different trading timeframes and assets.
Relative Strength Index (RSI) Filtering:
Overbought/Oversold Signals: Incorporates RSI to avoid entering trades during overextended market conditions.
Adjustable Levels: Set your own RSI oversold and overbought thresholds for personalized signal generation.
Advanced Risk Management:
ATR-Based Stop Loss and Take Profit:
Adaptive Levels: Uses the Average True Range (ATR) to set stop loss and take profit points that adjust to market volatility.
Custom Multipliers: Modify ATR multipliers for both stop loss and take profit to control risk and reward ratios.
Minimum Volatility Filter: Ensures trades are only taken when market volatility exceeds a user-defined minimum, avoiding periods of low activity.
Time-Based Exit:
Holding Period Multiplier: Defines a maximum holding period based on the momentum length to reduce exposure to adverse movements.
Automatic Position Closure: Closes positions after the specified holding period is reached.
Session Filtering:
Trading Session Control: Limits trading to predefined market hours, helping to avoid illiquid periods.
Custom Session Times: Set your preferred trading session to match market openings, closings, or specific timeframes.
Visualization Tools:
Indicator Plots: Displays Bollinger Bands, Keltner Channels, and trend EMA on the chart for visual analysis.
Squeeze Signals: Marks squeeze conditions on the chart, providing clear visual cues for potential trade setups.
Customization Options:
Indicator Parameters: Fine-tune lengths and multipliers for Bollinger Bands, Keltner Channels, momentum calculation, and ATR.
Entry Filters: Choose to use trend and RSI filters to refine trade entries based on your strategy.
Risk Management Settings: Adjust stop loss, take profit, and holding periods to match your risk tolerance.
Trade Direction Control: Enable or disable long and short trades independently to align with your market strategy or compliance requirements.
Time Settings: Modify the trading session times and enable or disable the time filter as needed.
Use Cases:
Trend Traders: Benefit from aligning entries with the broader market trend while capturing breakout movements.
Swing Traders: Exploit periods of low volatility leading to significant price swings.
Risk-Averse Traders: Utilize advanced risk management features to protect capital and manage exposure.
Disclaimer:
This strategy is a tool to assist in trading decisions and should be used in conjunction with other analyses and risk management practices. Past performance is not indicative of future results. Always test the strategy thoroughly and adjust settings to suit your specific trading style and market conditions.

MERCURY by DrAbhiramSivprasad"MERCURY by DrAbhiramSivprasad"
Developed from over 10 years of personal trading experience, the Mercury Indicator is a strategic tool designed to enhance accuracy in trading decisions. Think of it as a guiding light—a supportive tool that helps traders refine and build more robust strategies by integrating multiple powerful elements into a single indicator. I’ll be sharing some examples to illustrate how I use this indicator in my own trading journey, highlighting its potential to improve strategy accuracy.
Reason behind the combination of emas , cpr and vwap is it provides very good support and resistance in my trading carrier so now i brought them together in one plate
How It Works:
Mercury combines three essential elements—EMA, VWAP, and CPR—each of which plays a vital role in detecting support and resistance:
Exponential Moving Averages (EMAs): Known for their strength in providing dynamic support and resistance levels, EMAs help in identifying trends and shifts in momentum. This indicator includes a dashboard with up to nine customizable EMAs, showing whether each is acting as support or resistance based on real-time price movement.
Volume Weighted Average Price (VWAP): VWAP also provides valuable support and resistance, often regarded as a fair price level by institutional traders. Paired with EMAs, it forms a dual-layered support/resistance system, adding an additional level of confirmation.
Central Pivot Range (CPR): By combining CPR with EMAs and VWAP, Mercury highlights “traffic blocks” in your target journey. This means it identifies zones where price is likely to stall or reverse, providing additional guidance for navigating entries and exits.
Why This Combination Matters:
Using these three tools together gives you a more complete view of the market. VWAP and EMAs offer dynamic trend direction and support/resistance, while CPR pinpoints critical price zones. This combination helps you find high-probability trades, adding clarity to complex market situations and enabling stronger confirmation on trend or reversal decisions.
How to Use:
Trend Confirmation: Check if all EMAs are aligned (green for uptrend, red for downtrend), which is visible in the EMA dashboard. An alignment across VWAP, CPR, and EMAs signifies high confidence in trend direction.
Breakouts & Breakdowns: Mercury has an alert system to signal when a price breakout or breakdown occurs across VWAP, EMA1, and EMA2. This can help in spotting strong directional moves.
Example Application: In my trading, I use Mercury to identify support/resistance zones, confirming trends with EMA/VWAP alignment and using CPR as a checkpoint. I find this especially useful for day trading and swing setups.
Recommended Timeframes:
Day Trading: 5 to 15-minute charts for swift, actionable insights.
Swing Trading: 1-hour or 4-hour charts for broader trend analysis.
Note:
The Mercury Indicator should be used as a supportive tool rather than a standalone strategy, guiding you toward informed decisions in line with your trading style and goals.
EXAMPLE OF TRADE
you can see the cart of XAUUSD on 11th nov 2024
1.SHORT POSITION - TIME FRAME 15 MIN
So here for a short position you need to wait for a breakdown candle which will print in orange post the candle you need to check ema dashboard is completly red that indicates no traffic blocks in your journey to destiny target from ema's and you can take the target from nearest cpr support line
TAKEN IN XAUUSD you can see in chart of XAUUSD on 7th nov
2.LONG POSITION - TIME FRAME 15 MIN -
So here for long position you need to wait for a breakout candle from indicator thats here is blue and check all ema boxes are green and candle body should close above all the 3 lines here it is the both ema 1 and 2 and the vwap line then you can take and entry and your target will be the nearest resistance from the daily cpr
3. STOP LOSS CRITERIA
After the entry any candle close below any of the last line from entry for example we have 3 lines vwap and ema 1 and 2 lines and u have made an entry and the last line before the entry is vwap then if any candle closes below vwap can be considered as stoploss like wise in any lines
The MERCURY indicator is a comprehensive trading tool designed to enhance traders' ability to identify trends, breakouts, and reversals effectively. Created by Dr. Abhiram Sivprasad, this indicator integrates several technical elements, including Central Pivot Range (CPR), EMA crossovers, VWAP levels, and a table-based EMA dashboard, to offer a holistic trading view.
Core Components and Functionality:
Central Pivot Range (CPR):
The CPR in MERCURY provides a central pivot level along with Below Central (BC) and Top Central (TC) pivots. These levels act as potential support and resistance, useful for identifying reversal points and zones where price may consolidate.
Exponential Moving Averages (EMAs):
MERCURY includes up to nine EMAs, with a customizable EMA crossover alert system. This feature enables traders to see shifts in trend direction, especially when shorter EMAs cross longer ones.
VWAP (Volume-Weighted Average Price):
VWAP is incorporated as a dynamic support/resistance level and, combined with EMA crossovers, helps refine entry and exit points for higher probability trades.
Breakout and Breakdown Alerts:
MERCURY monitors conditions for upside and downside breakouts. For an upside breakout, all EMAs turn green and a candle closes above VWAP, EMA1, and EMA2. Similarly, all EMAs turning red, combined with a close below VWAP and EMA1/EMA2, signals a downside breakdown. Continuous alerts are available until the trend shifts.
Real-Time EMA Dashboard:
A table displays each EMA’s relative position (Above or Below), helping traders quickly gauge trend direction. Colors in the table adjust to long/short conditions based on EMA alignment.
Usage Recommendations:
Trend Confirmation:
Use the CPR, EMA alignments, and VWAP to confirm uptrends and downtrends. The table highlights trends, making it easy to spot long or short setups at a glance.
Breakout and Breakdown Alerts:
The alert system is customizable for continuous notifications on critical price levels. When all EMAs align in one direction (green for long, red for short) and the close is above or below VWAP and key EMAs, the indicator confirms a breakout/breakdown.
Adaptable for Different Styles:
Day Trading: Traders can set shorter EMAs for quick insights.
Swing Trading: Longer EMAs combined with CPR offer insights into sustained trends.
Recommended Settings:
Timeframes: MERCURY is suitable for timeframes as low as 5 minutes for intraday traders, up to daily charts for trend analysis.
Symbols: Works across forex, stocks, and crypto. Adjust EMA lengths for asset volatility.
Example Strategy:
Long Entry: When the price crosses above CPR and closes above both EMA1 and EMA2.
Short Entry: When the price falls below CPR with a close below both EMA1 and EMA2.

Rainbow EMA Areas with Volatility HighlightThe indicator provides traders with an enhanced visual tool to observe price movements, trend strength, and market volatility on their charts. It combines multiple EMAs (Exponential Moving Averages) with color-coded areas to indicate the market’s directional bias and a high-volatility highlight for detecting times of increased market activity.
Explanation of Key Components
Multiple EMAs (Exponential Moving Averages):
Six different EMAs are calculated for various periods (15, 45, 100, 150, 200, 300).
Each EMA period represents a different timeframe, from short-term to long-term trends, providing a well-rounded view of price behavior across different market cycles.
The EMAs are color-coded for easy differentiation:
Green shades indicate bullish trends when prices are above the EMAs.
Red shades indicate bearish trends when prices are below the EMAs.
The space between each EMA is filled with a gradient color, creating a "wave" effect that helps identify the market’s overall direction.
ATR-Based Volatility Detection:
The ATR (Average True Range), a measure of market volatility, is used to assess how much the price is fluctuating. When volatility is high, price movements are typically more significant, indicating potential trading opportunities or times to exercise caution.
The indicator calculates ATR and uses a customizable multiplier to set a high-volatility threshold.
When the ATR exceeds this threshold, it signals that the market is experiencing high volatility.
Visual High Volatility Highlight:
A yellow background appears on the chart during periods of high volatility, giving a subtle but clear visual indication that the market is active.
This highlight helps traders spot potential breakout areas or increased activity zones without obstructing the EMA areas.
Volatility Signal Markers:
Small, red triangular markers are plotted above price bars when high volatility is detected, marking these areas for additional emphasis.
These signals serve as alerts to help traders quickly recognize high volatility moments where price moves may be stronger.
How to Use This Indicator
Identify Trends Using EMA Areas:
Bullish Trend: When the price is above most or all EMAs, and the EMA areas are colored in shades of green, it indicates a strong bullish trend. Traders might look for buy opportunities in this scenario.
Bearish Trend: When the price is below most or all EMAs, and the EMA areas are colored in shades of red, it signals a bearish trend. This condition can suggest potential sell opportunities.
Consolidation or Neutral Trend: If the price is moving within the EMA bands without a clear green or red dominance, the market may be in a consolidation phase. This period often precedes a breakout in either direction.
Volatility-Based Entries and Exits:
High Volatility Areas: The yellow background and red triangular markers signal high-volatility areas. This information can be valuable for identifying potential breakout points or strong moves.
Trading in High Volatility: During high-volatility phases, the market may experience rapid price changes, which can be ideal for breakout trades. However, high volatility also involves higher risk, so traders may adjust their strategies accordingly (e.g., setting wider stops or adjusting position sizes).
Trading in Low Volatility: When the yellow background and markers are absent, volatility is lower, indicating a calmer market. In these times, traders may choose to look for range-bound trading opportunities or wait for the next trend to develop.
Combining with Other Indicators:
This indicator works well in combination with momentum or oscillating indicators like RSI or MACD, providing a well-rounded view of the market.
For example, if the indicator shows a bullish EMA area with high volatility, and an RSI is trending up, it could be a stronger buy signal. Conversely, if the indicator shows a bearish EMA area with high volatility and RSI is trending down, this could be a stronger sell signal.
Practical Trading Examples
Bullish Trend in High Volatility:
Price is above the EMAs, showing green EMA areas, and the high volatility background is active.
This indicates a strong bullish trend with significant price movement potential.
A trader could look for breakout or continuation entries in the direction of the trend.
Bearish Reversal Signal:
Price crosses below the EMAs, showing red EMA areas, while high volatility is also detected.
This suggests that the market may be reversing to a bearish trend with increased price movement.
Traders could consider taking short positions or setting stops on existing long trades.
This indicator is designed to provide a rich visual experience, making it easy to spot trends, consolidations, and volatility zones at a glance. It is best used by traders who benefit from visual cues and who seek a quick understanding of both trend direction and market activity. Let me know if you'd like further customization or additional functionalities!

TrendWave EMA/VWAP IndicatorThe TrendWave EMA/VWAP Indicator is a powerful technical analysis tool designed for traders seeking to enhance their market strategies. By combining the dynamic Exponential Moving Average (EMA) and the Volume Weighted Average Price (VWAP), this indicator provides valuable insights into price trends and potential trading signals, allowing for informed decision-making in various market conditions.
Key Features:
Exponential Moving Average (EMA):
The EMA component helps traders identify the direction of the prevailing trend by giving more weight to recent price action. This responsiveness makes the EMA an essential tool for trend-following strategies.
Customizable Length: Users can adjust the EMA length (default set to 50 periods) to align with their specific trading style and preferences.
Volume Weighted Average Price (VWAP):
The VWAP is crucial for evaluating the average price of a security throughout the trading day, factoring in volume. It serves as a benchmark for price action and can help traders identify significant support and resistance levels.
Real-time Benchmarking: The VWAP enables traders to assess current prices against historical averages, improving their entry and exit strategies.
Signal Generation:
The TrendWave EMA/VWAP Indicator generates clear buy and sell signals based on the interaction between the price and the VWAP:
Bullish Signal: Triggered when the price crosses above the VWAP, indicating a potential upward movement.
Bearish Signal: Triggered when the price crosses below the VWAP, suggesting a potential downward movement.
These signals are visually represented with intuitive arrows on the chart, facilitating quick recognition of trading opportunities.
User-Friendly Interface:
The indicator allows traders to enable or disable components (EMA and VWAP) based on their preferences, ensuring a personalized trading experience.
Clear color coding enhances visual clarity: the EMA is displayed in blue, while the VWAP is shown in orange.
Use Cases:
Trend Following: Use the EMA to confirm the direction of the trend and make trades that align with that trend.
Price Action Analysis: Employ the VWAP to determine the average trading price and identify key support/resistance levels.
Signal Confirmation: Combine signals from both the EMA and VWAP to enhance trading strategies and decision-making.
The TrendWave EMA/VWAP Indicator is an essential addition to any trader's toolkit. By leveraging the strengths of both the EMA and VWAP, this indicator empowers traders to make informed, data-driven decisions and capitalize on market movements with confidence.

TEMA Crosses_AIT with Manual TEMA CalculationTitle: TEMA Crosses_AIT Indicator
Description:
The TEMA Crosses_AIT Indicator is designed for traders looking to leverage the Triple Exponential Moving Average (TEMA) to identify trend reversals and momentum shifts in the market. This indicator calculates both fast and slow TEMA lines and signals potential buy or sell opportunities based on crossovers between these two lines.
Key Features:
Fast TEMA (TEMAF):
Default period: 20 (adjustable)
Represents the short-term trend and reacts quickly to price changes.
Slow TEMA (TEMAS):
Default period: 200 (adjustable)
Represents the long-term trend, smoothing out price fluctuations to give a clearer view of the overall direction.
Signal Generation:
Long Signal: A long (buy) signal is generated when the fast TEMA crosses above the slow TEMA, indicating a potential upward trend.
Short Signal: A short (sell) signal is generated when the fast TEMA crosses below the slow TEMA, indicating a potential downward trend.
Color-coded Visualization:
The fast TEMA line is displayed in green when it is above the slow TEMA (bullish signal) and in red when below (bearish signal).
The slow TEMA line is displayed in white.
A yellow triangle appears below the price bar for long entries.
A fuchsia triangle appears above the price bar for short entries.
How It Works:
The indicator calculates the Triple Exponential Moving Average (TEMA) manually using exponential moving averages (EMA). The TEMA is calculated by subtracting the second EMA from three times the first EMA, then adding the third EMA. This provides a smoother trend line that reacts more quickly than a traditional EMA, making it ideal for spotting trend changes.
Customizable Inputs:
TEMAF Period: Adjust the period of the fast TEMA to fit your trading style.
TEMAS Period: Adjust the period of the slow TEMA to match the time frame you are analyzing.
Use Cases:
Trend Reversals: The crossovers between the fast and slow TEMA provide clear signals for potential trend reversals, which can be used to enter or exit trades.
Momentum Confirmation: The color-coded TEMA lines allow traders to easily identify whether the short-term momentum is aligned with the long-term trend, helping to confirm the strength of a move.
Recommendations:
This indicator works well with other momentum-based tools like RSI or MACD for confirming signals and identifying overbought or oversold conditions. It is suitable for use across different asset classes, including stocks, cryptocurrencies, forex, and commodities.
Disclaimer:
The TEMA Crosses_AIT indicator should not be used as a standalone trading strategy. It is recommended to combine this indicator with other forms of analysis and risk management techniques. Always backtest the indicator on historical data before applying it to live trades.

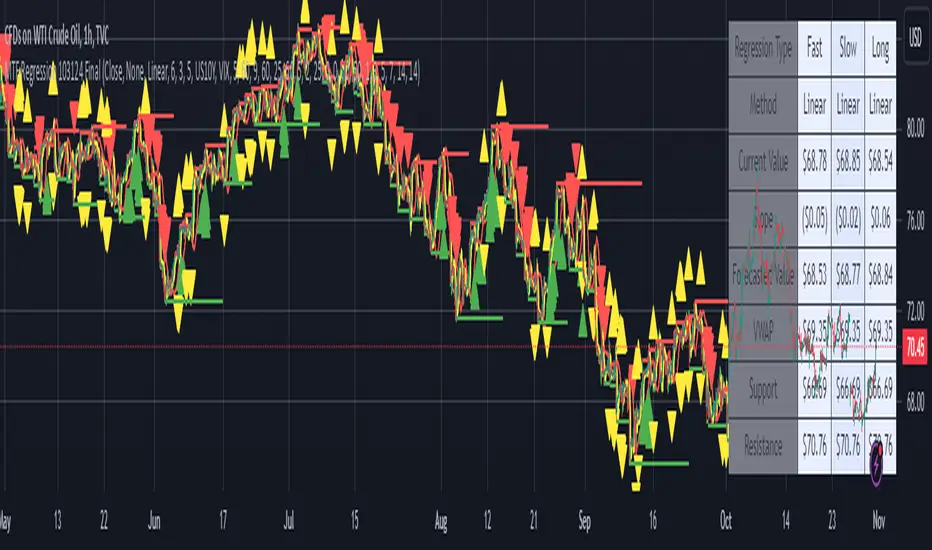
MTF Regression with Forecast### **MTF Regression with Forecast, Treasury Yield, Additional Variable & VWAP Filter - Enhanced with Long Regression**
Unlock advanced market insights with our **MTF Regression** indicator, meticulously designed for traders seeking comprehensive multi-timeframe analysis combined with powerful forecasting tools. Whether you're a seasoned trader or just starting out, this indicator offers a suite of features to enhance your trading strategy.
#### **🔍 Key Features:**
- **Multi-Timeframe (MTF) Regression:**
- **Fast, Slow, & Long Regressions:** Analyze price trends across multiple timeframes to capture both short-term movements and long-term trends.
- **Customizable Price Inputs:**
- **Flexible Price Selection:** Choose between Close, Open, High, or Low prices to suit your trading style.
- **Price Transformation:** Option to apply Exponential Moving Averages (EMA) for smoother trend analysis.
- **Diverse Regression Methods:**
- **Multiple Algorithms:** Select from Linear, Exponential, Hull Moving Average (HMA), Weighted Moving Average (WMA), or Spline regressions to best fit your analysis needs.
- **Integrated External Data:**
- **10-Year Treasury Yield:** Incorporate macroeconomic indicators to refine regression accuracy.
- **Additional Variables:** Enhance your analysis by integrating data from other tickers (e.g., NASDAQ:AAPL).
- **Advanced Filtering Options:**
- **VWAP Filter:** Align signals with the Volume Weighted Average Price for improved trade entries.
- **Price Action Filter:** Ensure price behavior supports the generated signals for higher reliability.
- **Enhanced Signal Generation:**
- **Bullish & Bearish Signals:** Identify potential trend reversals and continuations with clear visual cues.
- **Predictive Signals:** Forecast future price movements with forward-looking arrows based on regression slopes.
- **Slope & Acceleration Thresholds:** Customize minimum slope and acceleration levels to fine-tune signal sensitivity.
- **Forecasting Capabilities:**
- **Projection Lines:** Visualize future price trends by extending regression lines based on current slope data.
- **User-Friendly Interface:**
- **Organized Settings Groups:** Easily navigate through price inputs, regression settings, integration options, and more.
- **Customizable Alerts:** Stay informed with configurable alerts for bullish, bearish, and predictive signals.
#### **📈 Why Choose MTF Regression Indicator?**
- **Comprehensive Analysis:** Combines multiple regression techniques and external data sources for a well-rounded market view.
- **Flexibility:** Highly customizable to fit various trading strategies and preferences.
- **Enhanced Decision-Making:** Provides clear signals and forecasts to support informed trading decisions.
- **Efficiency:** Optimized to deliver reliable performance without overloading your trading platform.
Elevate your trading game with the **MTF Regression with Forecast, Treasury Yield, Additional Variable & VWAP Filter** indicator. Harness the power of multi-timeframe analysis and predictive forecasting to stay ahead in the dynamic markets.
---
*Feel free to reach out for more information or support. Happy Trading!*
EMA GridThe EMA Grid indicator is a powerful tool that calculates the overall market sentiment by comparing the order of 20 different Exponential Moving Averages (EMAs) over various lengths. The indicator assigns a rating based on how well-ordered the EMAs are relative to each other, representing the strength and direction of the market trend. It also smooths out the macro movements using cumulative calculations and visually represents the market sentiment through color-coded bands.
EMA Calculation:
The indicator uses a series of EMAs with different lengths, starting from 5 and going up to 100. Each EMA is calculated either using the exponential moving averages.
The EMAs form the grid that the indicator uses to measure the order and distance between them.
Rating Calculation:
The indicator computes the relative distance between consecutive EMAs and sums these differences.
The cumulative sum is further smoothed using multiple EMAs with different lengths (from 3 to 21). This smooths out short-term fluctuations and helps identify broader trends.
Market Sentiment Rating:
The overall sentiment is calculated by comparing the values of these smoothing EMAs. If the shorter-term EMA is above the longer-term EMA, it contributes positively to the sentiment; otherwise, it contributes negatively.
The final rating is a normalized value based on the relationship between these EMAs, producing a sentiment score between 1 (bullish) and -1 (bearish).
Color Coding and Bands:
The indicator uses the sentiment rating to color the space between the 100 EMA and 200 EMA, representing the strength of the trend.
If the sentiment is bullish (rating > 0), the band is shaded green. If the sentiment is bearish (rating < 0), the band is shaded red.
The intensity of the color is based on the strength of the sentiment, with stronger trends resulting in more saturated colors.
Utility for Traders:
The EMA Grid is ideal for traders looking to gauge the broader market trend by analyzing the structure and alignment of multiple EMAs. The color-coded band between the 100 and 200 EMAs provides an at-a-glance view of market momentum, helping traders make informed decisions based on the trend's strength and direction.
This indicator can be used to identify bullish or bearish conditions and offers a smoothed perspective on market trends, reducing noise and highlighting significant trend shifts.

Trend Fusion: ADX&EMA+Ichimoku (Custom)SAME AS THE ORIGINAL (WITHOUT BOTTOM PART)
Trend Fusion: ADX & EMA+Ichimoku is an innovative indicator designed to provide traders with comprehensive insights into market trends. Combining the power of the Average Directional Index (ADX) with Exponential Moving Averages (EMA) and the Ichimoku Cloud, this indicator offers a sophisticated approach to trend analysis.
This indicator stands out for its unique integration of multiple trend-following indicators, offering traders a holistic view of market dynamics. Unlike traditional trend indicators that focus solely on price movements, Trend Fusion incorporates the ADX, EMA, and Ichimoku Cloud to provide a more nuanced understanding of trend strength and direction. By combining these indicators, traders can make more informed decisions and enhance their trading strategies.
How it works:
Trend Fusion generates buy and sell signals based on the convergence of these indicators. A combination of strong ADX readings, EMA crossovers, and alignment with the Ichimoku Cloud confirms trend direction and provides entry and exit points for traders.
Average Directional Index (ADX): Measures the strength of the prevailing trend by analyzing price movements. A rising ADX indicates a strengthening trend, while a falling ADX suggests weakening momentum.
Exponential Moving Averages (EMA): Detects potential trend reversals through crossover signals. A bullish crossover (fast EMA crossing above slow EMA) suggests an uptrend, while a bearish crossover indicates a downtrend.
Ichimoku Cloud: Provides support and resistance levels along with trend direction. Price movements above the cloud indicate bullish sentiment, while movements below the cloud suggest bearish sentiment.
How to useColour codes:
Green Candles: Represent a strong uptrend, indicating robust buying momentum. The intensity of green color deepens with increasing trend strength.
Red Candles: Indicate a strong downtrend, signaling significant selling pressure in the market. The intensity of red color deepens with increasing trend strength.
Yellow Candles: Suggest a weak trend, characterized by indecision and lack of clear direction. The intensity of yellow color varies based on the strength of the trend, with lighter shades indicating weaker trends and darker shades suggesting slightly stronger trends.
Trend Strength: Monitor the ADX to gauge the strength of the prevailing trend. Higher ADX values indicate stronger trends, while lower values suggest weaker trends.
Trend Direction: Confirm trend direction using EMA crossovers and Ichimoku Cloud signals. Look for bullish crossovers and price movements above the cloud for uptrends, and bearish crossovers and movements below the cloud for downtrends.
Entry and Exit Signals: Enter trades when all components align, signaling a strong trend. Use EMA crossovers and cloud confirmations to identify potential entry points, and consider exiting trades when these signals reverse.
The ADX calculation and signal logic are based on the ADX script by PineCoders, with modifications to integrate it into this indicator.
The EMA crossover logic is adapted from the GDAX EMA Cross script by stefano98.
The Ichimoku Cloud calculation and plotting are adapted from the Ichimoku Cloud script by lonesometheblue.
Trading involves risk, and past performance is not indicative of future results. It is recommended to use this indicator alongside other technical analysis tools and risk management strategies.

Swiss Knife [MERT]Introduction
The Swiss Knife indicator is a comprehensive trading tool designed to provide a multi-dimensional analysis of the market. By integrating a wide array of technical indicators across multiple timeframes, it offers traders a holistic view of market sentiment, momentum, and potential reversal points. This indicator is particularly useful for traders looking to combine trend analysis, momentum indicators, volume data, and price action into a single, easy-to-read format.
---
Key Features
Multi-Timeframe Analysis : Evaluates indicators on Daily , 4-Hour , 1-Hour , and 15-Minute timeframes.
Comprehensive Indicator Suite : Incorporates MACD , Awesome Oscillator (AO) , Parabolic SAR , SuperTrend , DPO , RSI , Stochastic Oscillator , Bollinger Bands , Ichimoku Cloud , Chande Momentum Oscillator (CMO) , Donchian Channels , ADX , volume-based momentum indicators, Fractals , and divergence detection.
Market Sentiment Scoring : Aggregates signals from multiple indicators to provide an overall sentiment score.
Visual Aids : Displays EMA lines, trendlines, divergence signals, and a sentiment table directly on the chart.
Super Trend Reversal Signals : Identifies potential market reversal points by assessing the momentum of automated trading bots.
---
Explanation of Each Indicator
Moving Average Convergence Divergence (MACD)
- Purpose : Measures the relationship between two moving averages of price.
- Interpretation : A positive histogram suggests bullish momentum; a negative histogram indicates bearish momentum.
Awesome Oscillator (AO)
- Purpose : Gauges market momentum by comparing recent market movements to historic ones.
- Interpretation : Above zero indicates bullish momentum; below zero indicates bearish momentum.
Parabolic SAR (SAR)
- Purpose : Identifies potential reversal points in price direction.
- Interpretation : Dots below price suggest an uptrend; dots above price suggest a downtrend.
SuperTrend
- Purpose : Determines the prevailing market trend.
- Interpretation : Provides buy or sell signals based on price movements relative to the SuperTrend line.
Detrended Price Oscillator (DPO)
- Purpose : Removes trend from price to identify cycles.
- Interpretation : Values above zero suggest price is above the moving average; values below zero indicate it is below.
Relative Strength Index (RSI)
- Purpose : Measures the speed and change of price movements.
- Interpretation : Values above 50 indicate bullish momentum; values below 50 indicate bearish momentum.
Stochastic Oscillator
- Purpose : Compares a particular closing price to a range of its prices over a certain period.
- Interpretation : Values above 50 indicate bullish conditions; values below 50 indicate bearish conditions.
Bollinger Bands (BB)
- Purpose : Measures market volatility and provides relative price levels.
- Interpretation : Price above the middle band suggests bullishness; below the middle band suggests bearishness.
Ichimoku Cloud
- Purpose : Provides support and resistance levels, trend direction, and momentum.
- Interpretation : Bullish signals when price is above the cloud; bearish signals when price is below the cloud.
Chande Momentum Oscillator (CMO)
- Purpose : Measures momentum on both up and down days.
- Interpretation : Values above 50 indicate strong upward momentum; values below -50 indicate strong downward momentum.
Donchian Channels
- Purpose : Identifies volatility and potential breakouts.
- Interpretation : Price above the upper band suggests bullish breakout; below the lower band suggests bearish breakout.
Average Directional Index (ADX)
- Purpose : Measures the strength of a trend.
- Interpretation : DI+ above DI- indicates bullish trend; DI- above DI+ indicates bearish trend.
Volume Momentum Indicators (VolMom, CumVolMom, POCMom)
- Purpose : Analyze volume to assess buying and selling pressure.
- Interpretation : Positive values suggest bullish volume momentum; negative values indicate bearish volume momentum.
Fractals
- Purpose : Identify potential reversal points in the market.
- Interpretation : Up fractals may indicate a future downtrend; down fractals may indicate a future uptrend.
Divergence Detection
- Purpose : Identifies divergences between price and various indicators (RSI, MACD, Stochastic, OBV, MFI, A/D Line).
- Interpretation : Bullish divergences suggest potential upward reversal; bearish divergences suggest potential downward reversal.
- Note : This functionality utilizes the library from Divergence Indicator .
---
Coloring Scheme
Background Color
- Purpose : Reflects the overall market sentiment by combining sentiment scores from all indicators across different timeframes.
- Interpretation :
- Green Shades : Indicate bullish market sentiment.
- Red Shades : Indicate bearish market sentiment.
- Intensity : The strength of the color corresponds to the strength of the sentiment score.
Sentiment Table
- Purpose : Displays the status of each indicator across different timeframes.
- Interpretation :
- Green Cell : The indicator suggests a bullish signal.
- Red Cell : The indicator suggests a bearish signal.
- Percentage Score : Indicates the overall bullish or bearish sentiment on that timeframe.
Exponential Moving Averages (EMAs)
- Purpose : Provide dynamic support and resistance levels.
- Colors :
- EMA 10 : Lime
- EMA 20 : Yellow
- EMA 50 : Orange
- EMA 100 : Red
- EMA 200 : Purple
Trendlines
- Purpose : Visual representation of support and resistance levels based on pivot points.
- Interpretation :
- Upward Trendlines : Colored green , indicating support levels.
- Downward Trendlines : Colored red , indicating resistance levels.
- Note : Trendlines are drawn using the library from Simple Trendlines .
---
Utility of Market Sentiment
The indicator aggregates signals from multiple technical indicators across various timeframes to compute an overall market sentiment score . This comprehensive approach helps traders understand the prevailing market conditions by:
Confirming Trends : Multiple indicators pointing in the same direction can confirm the strength of a trend.
Identifying Reversals : Divergences and fractals can signal potential turning points.
Timeframe Alignment : Aligning signals across different timeframes can enhance the probability of successful trades.
---
Divergences
Divergence occurs when the price of an asset moves in the opposite direction of a technical indicator, suggesting a potential reversal.
- Bullish Divergence : Price makes a lower low, but the indicator makes a higher low.
- Bearish Divergence : Price makes a higher high, but the indicator makes a lower high.
The indicator detects divergences for:
RSI
MACD
Stochastic Oscillator
On-Balance Volume (OBV)
Money Flow Index (MFI)
Accumulation/Distribution Line (A/D Line)
By identifying these divergences, traders can spot early signs of trend reversals and adjust their strategies accordingly.
---
Trendlines
Trendlines are essential tools for identifying support and resistance levels. The indicator automatically draws trendlines based on pivot points:
- Upward Trendlines (Support) : Connect higher lows, indicating an uptrend.
- Downward Trendlines (Resistance) : Connect lower highs, indicating a downtrend.
These trendlines help traders visualize the trend direction and potential breakout or reversal points.
---
Super Trend Reversals (ST Reversal)
The core idea behind the Super Trend Reversals indicator is to assess the momentum of automated trading bots (often referred to as 'Supertrend bots') that enter the market during critical turning points. Specifically, the indicator is tuned to identify when the market is nearing bottoms or peaks, just before it shifts direction based on the triggered Supertrend signals. This approach helps traders:
Engage Early : Enter the market as reversal momentum builds up.
Optimize Entries and Exits : Enter under favorable conditions and exit before momentum wanes.
By capturing these reversal points, traders can enhance their trading performance.
---
Conclusion
The Swiss Knife indicator serves as a versatile tool that combines multiple technical analysis methods into a single, comprehensive indicator. By assessing various aspects of the market—including trend direction, momentum, volume, and price action—it provides traders with valuable insights to make informed trading decisions.
---
Citations
- Divergence Detection Library : Divergence Indicator by DevLucem
- Trendline Drawing Library : Simple Trendlines by HoanGhetti
---
Note : This indicator is intended for informational purposes and should be used in conjunction with other analysis techniques. Always perform due diligence before making trading decisions.
---

Dynamic ConfluenceThe Dynamic MA Confluence Indicator is a powerful tool designed to simplify your trading experience by automatically identifying the most influential moving average (MA) lengths on your chart. Whether you're using Simple Moving Averages (SMA) or Exponential Moving Averages (EMA), this indicator helps you pinpoint the MA length that holds the greatest confluence, allowing you to make informed trading decisions with ease.
How It Works:
This indicator analyzes a wide range of moving averages, from short-term to long-term, to determine which ones are closest to each other. By setting a "Proximity Percentage," you can control how close these MAs need to be to be considered as having confluence. The indicator then calculates the average of these close MAs to establish a dynamic support or resistance level on your chart.
Why Use This Indicator?
Automatic Optimization: Unsure of which MA length to apply? The indicator automatically highlights the MA length with the most confluence, giving you a clear edge in identifying significant market levels.
Adaptability: Choose between SMA and EMA to suit your trading strategy and market conditions.
Enhanced Decision-Making: By focusing on the MA length with the greatest influence, you can better anticipate market movements and adjust your strategies accordingly.
Customizable Sensitivity: Adjust the Proximity Percentage to fine-tune the indicator's sensitivity, ensuring it aligns with your trading preferences.
Key Feature:
Current Key Confluence MA Length: Displayed in an optional table, this feature shows the MA length that currently has the most impact on the confluence level, providing you with actionable insights at a glance.
Whether you're a seasoned trader or just starting, the Dynamic MA Confluence Indicator offers a streamlined approach to understanding market dynamics, helping you trade smarter and with more confidence. This presentation text is designed to clearly communicate the purpose, functionality, and benefits of the indicator, making it easy for users to understand its value and how it can enhance their trading strategies.
The Dynamic MA Confluence Indicator is a tool designed to assist traders in analyzing market trends. It should not be considered as financial advice or a guarantee of future performance. Trading involves significant risk, and it is possible to lose more than your initial investment. Users should conduct their own research and consider their financial situation before making trading decisions. Always consult with a financial advisor if you are unsure about any trading strategies or decisions. This disclaimer is intended to remind users of the inherent risks in trading and the importance of conducting their own due diligence.

Composite Momentum█ Introduction
The Composite Momentum Indicator is a tool we came across that we found to be useful at detecting implied tops and bottoms within quick market cycles. Its approach to analyzing momentum through a combination of moving averages and summation techniques makes it a useful addition to the range of available indicators on TradingView.
█ How It Works
This indicator operates by calculating the difference between two moving averages—one fast and one slow, which can be customized by the user. The difference between these two averages is then expressed as a percentage of the fast moving average, forming the core momentum value which is then smoothed with an Exponential Moving Average is applied. The smoothed momentum is then compared across periods to identify directional changes in direction
Furthermore, the script calculates the absolute differences between consecutive momentum values. These differences are used to determine periods of momentum acceleration or deceleration, aiming to establish potential reversals.
In addition to tracking momentum changes, the indicator sums positive and negative momentum changes separately over a user-defined period. This summation is intended to provide a clearer picture of the prevailing market bias—whether it’s leaning towards strength or weakness.
Finally, the summed-up values are normalized to a percentage scale. This normalization helps in identifying potential tops and bottoms by comparing the relative strength of the momentum within a given cycle.
█ Usage
This indicator is primarily useful for traders who focus on detecting quick cycle tops and bottoms. It provides a view of momentum shifts that can signal these extremes, though it’s important to use it in conjunction with other tools and market analysis techniques. Given its ability to highlight potential reversals, it may be of interest to those who seek to understand short-term market dynamics.
█ Disclaimer
This script was discovered without any information about its author or original intent but was nonetheless ported from its original format that is available publicly. It’s provided here for educational purposes and should not be considered a guaranteed method for market analysis. Users are encouraged to test and understand the indicator thoroughly before applying it in real trading scenarios.
Uptrick: EMA Trend Indicator
### Overview
The goal of this script is to visually indicate on a trading chart whether all three Exponential Moving Averages (EMAs) are trending upwards (i.e., their slopes are positive). If all EMAs are trending upwards, the script will color the bars green. If not, the bars will be colored red.
### Key Concepts
1. **Exponential Moving Average (EMA)**: An EMA is a type of moving average that places more weight on recent data, making it more responsive to price changes compared to a simple moving average (SMA). In this script, we use three different EMAs with different lengths (20, 50, and 200 periods).
2. **Slope of an EMA**: The slope of an EMA refers to the direction in which the EMA is moving. If the current value of the EMA is higher than its value in the previous bar, the slope is positive (upward). Conversely, if the current value is lower than its previous value, the slope is negative (downward).
3. **Bar Color Coding**: The script changes the color of the bars on the chart to provide a visual cue:
- **Green Bars**: Indicate that all three EMAs are trending upwards.
- **Red Bars**: Indicate that one or more EMAs are not trending upwards.
### Detailed Breakdown
#### 1. Input Fields
- **EMA Lengths**: The script starts by allowing the user to input the lengths for the three EMAs. These lengths determine how many periods (e.g., days) are used to calculate each EMA.
- `ema20_length` is set to 20, meaning the first EMA uses the last 20 bars of data.
- `ema50_length` is set to 50, meaning the second EMA uses the last 50 bars of data.
- `ema200_length` is set to 200, meaning the third EMA uses the last 200 bars of data.
#### 2. EMA Calculation
- The script calculates the values of the three EMAs:
- **EMA 20**: This is calculated using the last 20 bars of closing prices.
- **EMA 50**: This is calculated using the last 50 bars of closing prices.
- **EMA 200**: This is calculated using the last 200 bars of closing prices.
These calculations result in three values for each bar on the chart, each representing the EMA value at that point in time.
#### 3. Determining EMA Slopes
- **EMA Slopes**: To understand the trend of each EMA, the script compares the current value of each EMA to its value in the previous bar:
- For the 20-period EMA, the script checks if today’s EMA value is higher than yesterday’s EMA value.
- This process is repeated for the 50-period and 200-period EMAs.
- If today’s EMA value is greater than yesterday’s value, the slope is positive (upward).
- If today’s EMA value is not greater (it is either equal to or less than yesterday’s value), the slope is not positive.
#### 4. Evaluating All Slopes
- **All Slopes Positive Condition**: The script combines the results of the individual slope checks into a single condition. It uses a logical "AND" operation:
- The condition will be `true` only if all three EMAs (20, 50, and 200) have positive slopes.
- If any one of the EMAs does not have a positive slope, the condition will be `false`.
#### 5. Coloring the Bars
- **Bar Coloring Logic**: Based on the above condition, the script decides the color of each bar on the chart:
- If all slopes are positive (condition is `true`), the bar is colored green.
- If any slope is not positive (condition is `false`), the bar is colored red.
- **Visual Cue**: This provides a quick, visual indication to traders:
- Green bars suggest that the market is in an upward trend across all three EMAs, which might indicate a strong bullish trend.
- Red bars suggest that the trend is not uniformly upward, which could be a sign of weakening momentum or a potential reversal.
#### 6. Alerts
- **Alert Conditions**: The script also allows for alert conditions to be set based on the slope analysis:
- An alert can be triggered when all EMA slopes are positive. This might be useful for traders who want to be notified when the market shows strong upward momentum.
### Summary
- The script essentially takes the market data and applies three different EMAs to it, each with a different time frame.
- It then checks the direction (slope) of each of these EMAs to determine if they are all trending upwards.
- If they are, the script colors the bar green, signaling a potentially strong bullish trend.
- If any of the EMAs is not trending upwards, it colors the bar red, indicating a potential issue with the strength of the trend.
This approach helps traders quickly assess market conditions based on multiple EMAs, providing a clearer picture of the overall trend across different time frames.